 MOGA World
Safety Stock Formula for Small Sellers, With a Worked Example
Most guides give you the safety stock formula as letters and stop there. This one works a single product by hand, with numbers you can swap for your own, and shows the one input that breaks the result most often: the delivery time your supplier promises instead of the one you actually get.
Short on time? The free sample page shows a stock check as one decision, with its reason and a Go button: See the free sample page
What safety stock is
Safety stock is the extra units you hold on top of what you expect to sell while an order is on its way, so a slow delivery or a busy week does not empty the shelf. It is not there to sell more. It covers two things going wrong at once: you sell faster than usual, and the delivery arrives later than usual.
It always travels with a second number, the reorder point: the stock level at which you place the order. The reorder point is what you expect to sell during the delivery, plus the safety stock. You work out both together.
The safety stock formula
Safety stock = (best daily sales × slowest delivery in days) minus (average daily sales × average delivery in days). This is the simple version, and it needs nothing more than your order history and your supplier mails. Four inputs:
- Average daily sales: units sold per day, on average.
- Best daily sales: your best recent day, leaving out a one off spike that will not repeat.
- Average delivery time: days between placing an order and receiving it, on average, from your last few deliveries.
- Slowest delivery time: the longest of those deliveries.
Reorder point = average daily sales × average delivery time + safety stock. The formula measures the gap between the worst case (your best sales day during your slowest delivery) and the normal case. That gap is what you keep on top.
A safety stock calculation, worked by hand
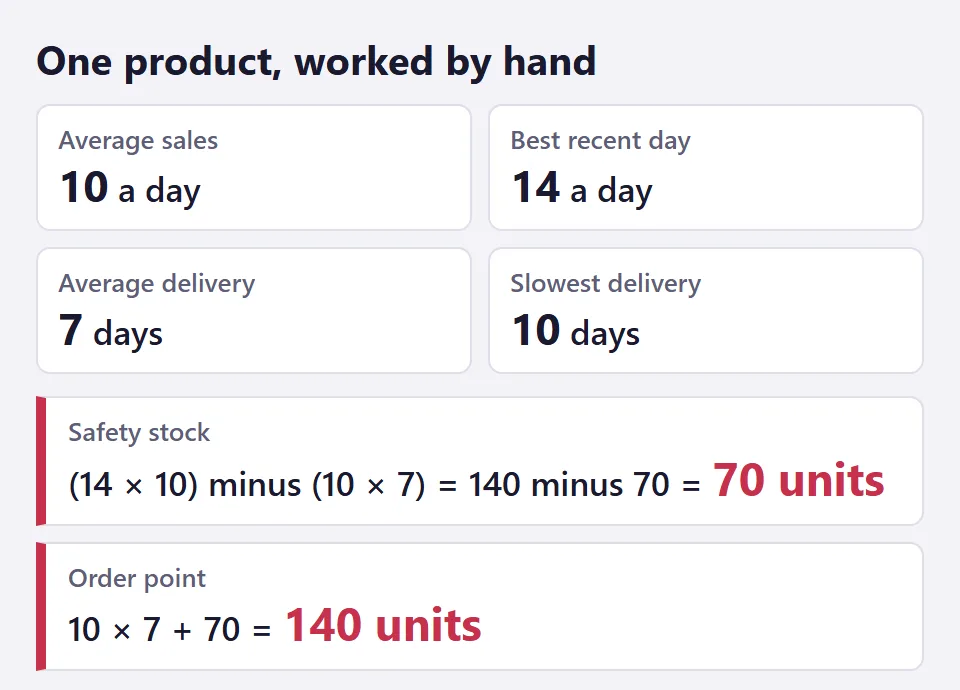
One product. You sell 10 a day on average and 14 on your best day. The supplier takes 7 days on average and 10 on the slowest delivery. You have 400 units today. The numbers are an example, and the arithmetic is what you repeat with yours.
| Step | Calculation | Result |
|---|---|---|
| 1. Days of stock | 400 ÷ 10 | 40 days |
| 2. Safety stock | (14 × 10) minus (10 × 7) = 140 minus 70 | 70 units |
| 3. Reorder point | 10 × 7 + 70 | 140 units |
With 400 units on the shelf you order when 140 are left. At 10 a day that is (400 minus 140) ÷ 10 = 26 days from today. If you already have 140 or fewer and have not ordered, the order is late.
At EUR 5 landed cost a unit, the 70 safety units are EUR 350 sitting on the shelf. That is the price of not running out in the bad case, and it is why you size it instead of doubling every order.
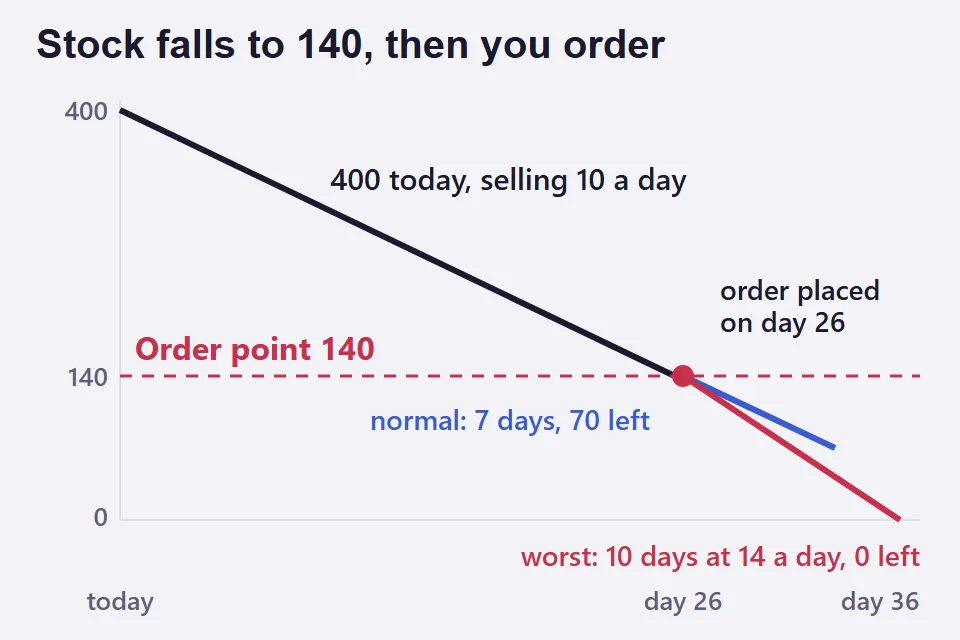
In numbers: you order at 140. In a normal 7 day delivery you sell 70 and 70 are left. In the worst case, 10 days at 14 a day, you sell 140 and arrive at zero, never below.
When the statistical formula pays off
The statistical version is safety stock = Z × standard deviation of daily sales × square root of the delivery time. Z comes from the service level you want: 1.28 covers about 90 percent of order cycles, 1.65 covers 95 percent, and 2.33 covers 99 percent. The standard deviation is how far daily sales swing around their average.
Same product, standard deviation of 3 units a day, 7 day delivery, 95 percent service level: 1.65 × 3 × √7 = 1.65 × 3 × 2.646 = 13 units. Reorder point: 10 × 7 + 13 = 83 units.
That is far below the 70 units of the simple version, for two reasons. The simple formula covers your best day and your slowest delivery at the same time. The statistical one accepts running out in about one cycle in twenty, and this short version assumes delivery time never varies.
Delivery time does vary, so there is a longer version. You can skip this paragraph and still use everything above. Say delivery time swings by about 1.5 days. You add two squared swings together: 7 days × 3 × 3 = 63 for sales, and 10 × 10 × 1.5 × 1.5 = 225 for delivery. The total is 288, its square root is 16.97, and 1.65 × 16.97 = 28 units, so the reorder point is 98. The lesson: late deliveries move the answer more than jumpy sales do.
Use the statistical version when all three are true:
- You have several months of daily sales per product, not just a monthly total.
- Demand is steady. A promotion or a peak season inflates the deviation and asks you to hold more stock than you need the rest of the year.
- Cash tied up in stock hurts more than an occasional stockout. Going from 95 to 99 percent costs units you may never sell.
If those are not true, the simple formula with your real numbers beats a statistical one built on data you do not have.
The most common mistake: promised delivery time instead of real
The delivery time your supplier quotes is for an order with no problems, not the one you will live through. Calculate with it and your safety stock comes out too low, so you order too late.
In the example, say the supplier promises 7 days and you treat that as fixed: (14 × 7) minus (10 × 7) = 28 units of safety stock, reorder point 10 × 7 + 28 = 98 units. You order at 98. The real delivery takes 10 days and you sell 14 a day, so you need 140 and have 98. You are 42 units short (140 minus 98) before the order lands. The right reorder point was 140.
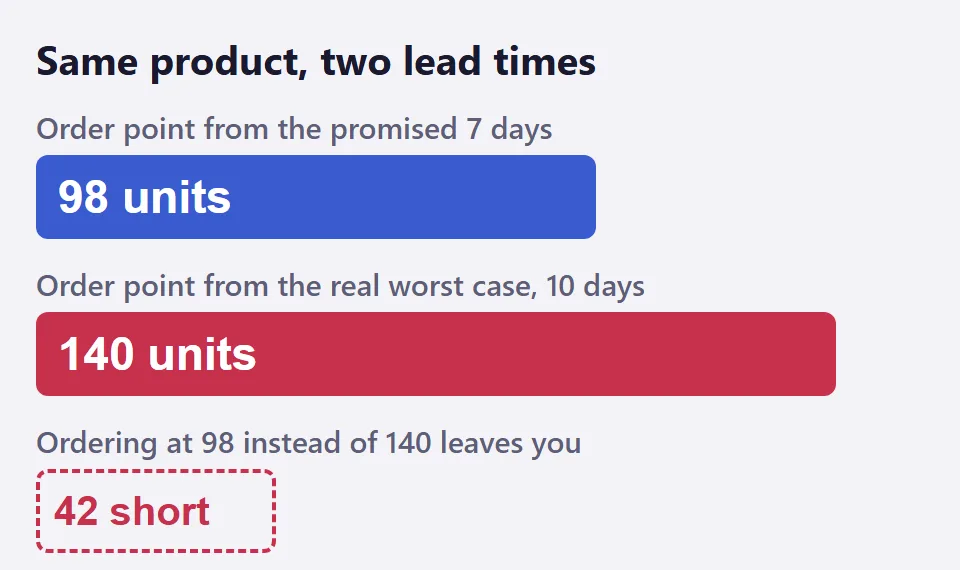
What to do: write down the order date and the receiving date of your last three deliveries and calculate with those, not with the quote. Two other things break the result: counting damaged or reserved units as stock, and treating a promotion week as normal sales.
Where to keep the calculation without inventory software
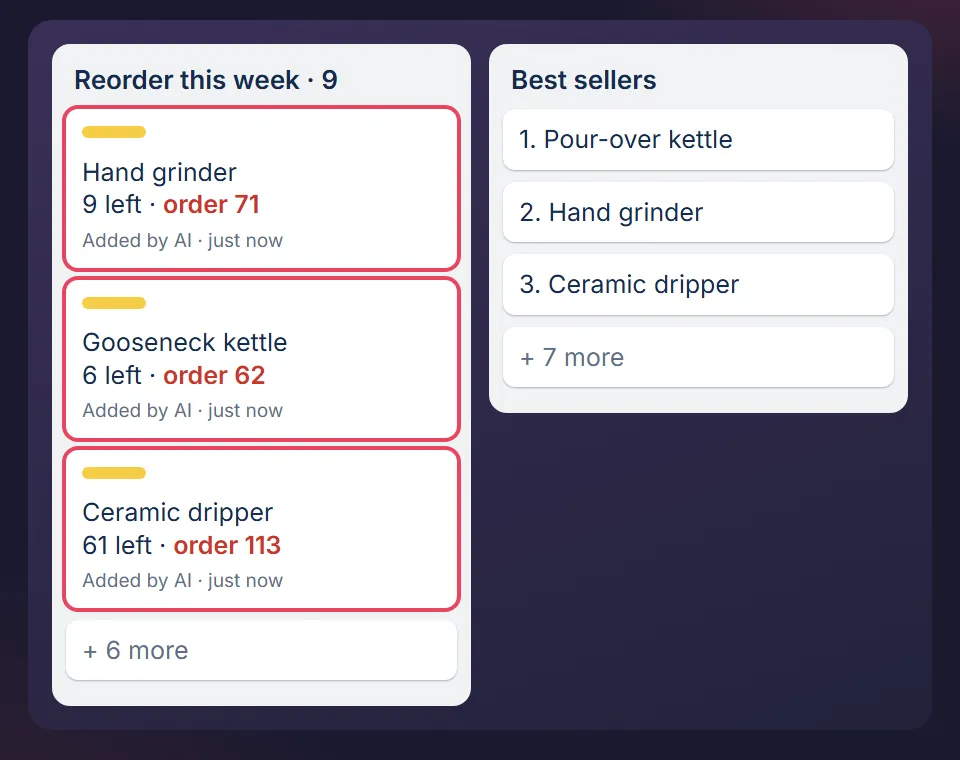
You do the safety stock inventory formula once per product. The hard part is looking again every week, and that needs a card with a fixed day, not software. The card says which products have reached their reorder point and what to do about them.
A weekly stock check card does that: it compares stock against each reorder point, and leaves one card per product that runs low, with units left and a suggested quantity. The quantity is a suggestion. The order is yours. The ecommerce SOP template uses a rougher rule for the same check, average sales × delivery time × 1.5, which gives 189 units in its sample (6 a day × 21 days × 1.5). Use that until you have the history for the formula on this page.
Where it stops
- A formula with bad data only makes you wrong faster. The numbers on this page are an example. Replace them with yours.
- It does not decide what to sell or at what price. It checks the business you already run.
- If your sales swing with the seasons, recalculate when your best day or your real delivery time changes, not once a year.
Questions about safety stock
What is the simplest safety stock formula?
(Best daily sales × slowest delivery in days) minus (average daily sales × average delivery in days). It uses only data you already have in your orders and your supplier mails, no standard deviation.
What is the difference between safety stock and the reorder point?
Safety stock is the extra reserve; the reorder point is the stock level at which you place the order. The reorder point includes what you sell while the delivery is on its way, plus that reserve.
When should I use the Z formula instead of the simple one?
When you have several months of daily sales per product and demand is steady. With little history or frequent promotions the deviation is unreliable, and the simple formula gives a more useful answer.
How often do I recalculate safety stock?
When your best sales day or your real delivery time changes. Comparing stock against the reorder point is the weekly part, and it is the step people forget.
Do I need inventory software for this?
Not to start. A spreadsheet or a Trello card is enough for a few products. When you reach hundreds of items the spreadsheet stops being practical, and that is when another tool pays off.
See the stock decision, free
The free sample page shows a stock check as one decision with its reason and a Go button. No signup, and nothing you press is sent. The free starter board, the Trello version of the weekly stock check, is the email step behind it.

Read next: Ecommerce SOP Template: the 6 Procedures a Seller Should Write First, with the other five weekly checks. All the boards with their procedures are on the packs page.
MOGA World is independent and not affiliated with Anthropic or Atlassian. Sample businesses and numbers in this article are invented. Questions: stef@mogaworld.co